Breast Cancer Survival Prediction

As a personal initiative in my data science journey, I have decided to work on at least one project every 2 weeks. In my last blog post, we saw the application of data science in the business sector, today we move to my favorite sector-healthcare. In this project, I will be training a machine learning model to predict if a patient will survive breast cancer or not depending on their demographics(age, gender),features of their cancer(proteins, hormone receptor status, tumor stage, histology) and the type of surgery they underwent.
Breast cancer is the most common cancer affecting women globally. It is also the leading cause of cancer-related deaths among women in Ghana as well.(Abigail Thomas,2017). Because Ghana has no population-based cancer registry, the best-known breast cancer incidences are estimated from hospital based data. Little is known about the survival of patients with breast cancer in Ghana, hence this project is very important. Unfortunately, I couldn't get access to any of these data sets so I used a data set from Kaggle.
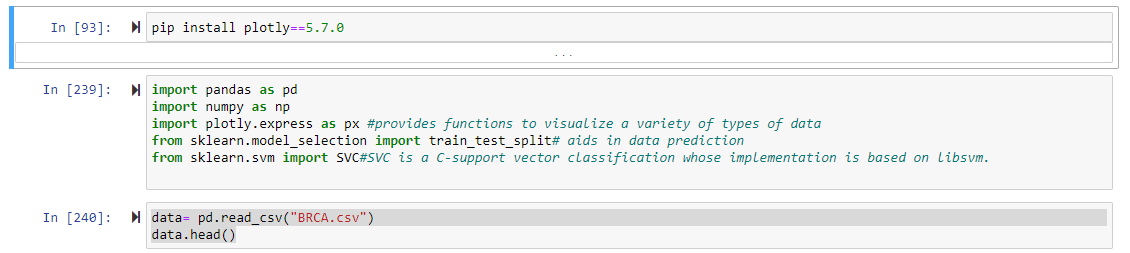
As usual, we first import all the packages we need to create the model and read the data:
The data set has 13 columns indicating the following patient details:
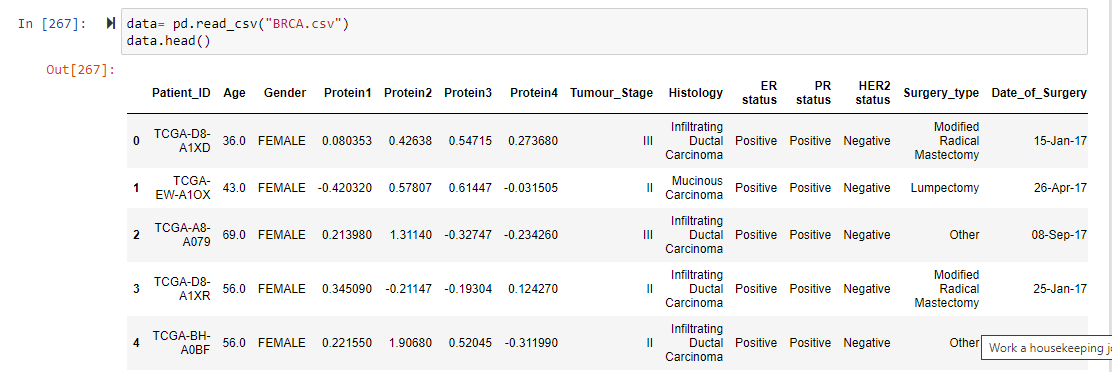 ID, age, gender, some proteins expressed by the cancer cells, stage of the cancer, histological type of cancer(infiltrating ductal carcinoma, lobular carcinoma, mucinous carcinoma), estrogen receptor status(ER status-positive/negative), progesterone receptor status(PR status-positive/negative), human epidermal growth factor receptor 2 (HER2 status-positive/negative),type of surgery(Lumpectomy, Simple Mastectomy, Modified Radical Mastectomy, Other),date of surgery, date of last visit and finally whether the patient is dead or alive.
Before we start working on the data, we want to ensure that it is clean. To ensure this we have to check to see if there are any missing values in any of the columns. Using a single line of code, we can see the number of missing values per column
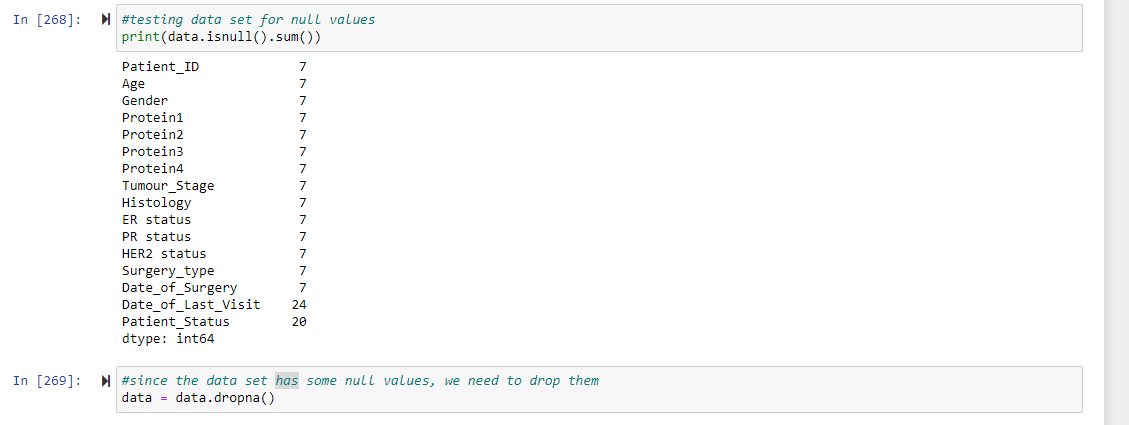 Next, we need to drop all the rows with missing values so it doesn't interfere with our analysis. So we started with 334 rows but we will be analyzing only 317 rows with no missing values.
Now let's start our analysis. It is common knowledge that breast cancer is prevalent in females than males. We can check our data set to confirm that by counting the males and females in the gender column. We can see that there are 313 females and 4 males, confirming the generally accepted facts.
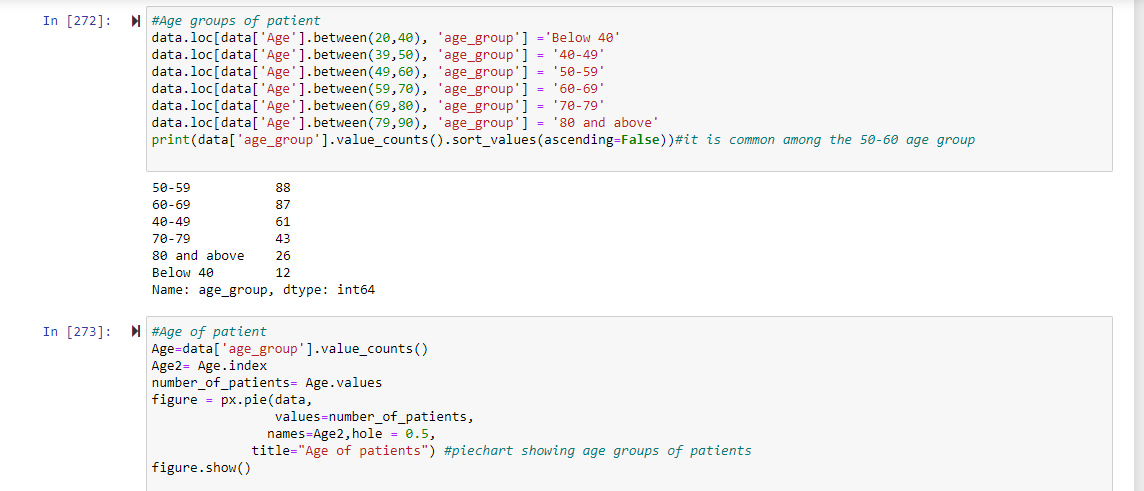
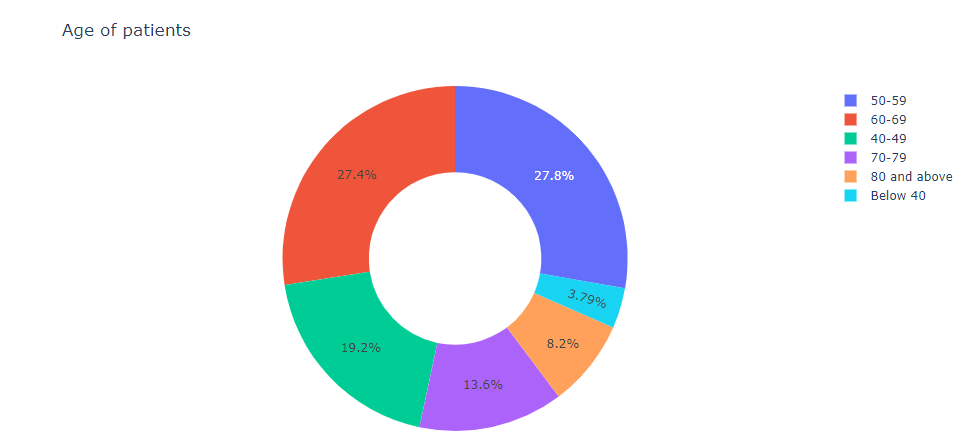
 Next, I was interested in finding out which age group had the most cases of breast cancer in my data set. So I decided to group the individual ages of the patients into specific age groups to improve the visualization of the results. I grouped them into ages below 40,40-49,50-59,60-69,70-79 and 80 and above. Next, I drew a pie chart to represent the results. We can see that breast cancer is more common between 50-59 age group(88 patients) with the 60-69 age group following closely( 87 patients). This data is important to initiate early screening and management of females before the cancer becomes full blown.
Next, I was interested in knowing the receptor status of the patients. Knowing the hormone receptor status of a patient's cancer helps doctors decide how to treat it. If a patient's cancer is either PR positive or ER positive or both positive, hormone therapy drugs can be used to either lower estrogen/progesterone levels or stop estrogen/progesterone from acting on breast cancer cells.
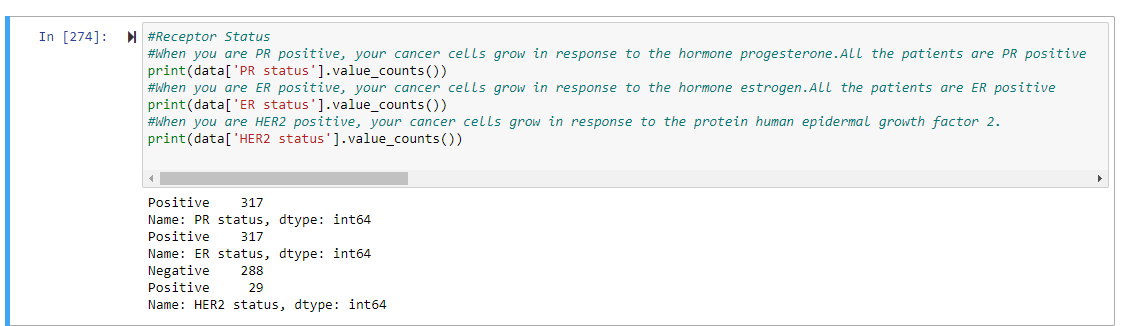
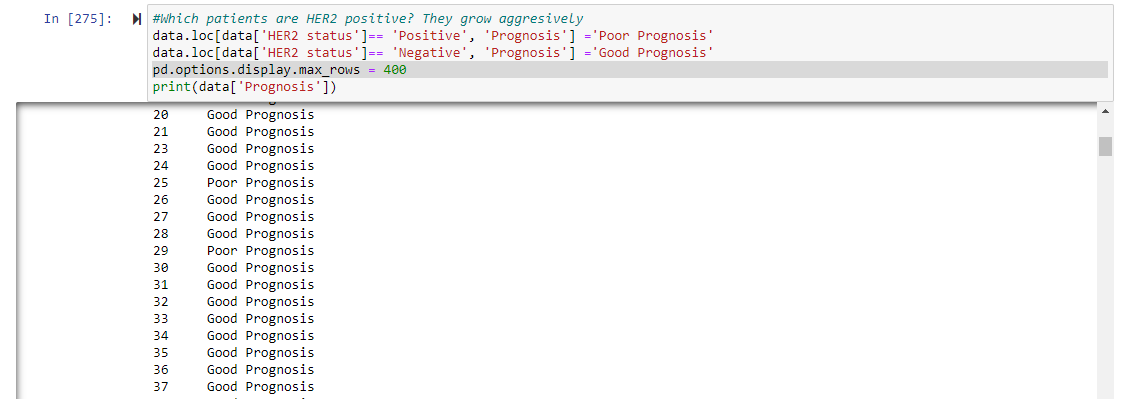
But from the data set, we see that all the patients are both PR and ER positive, which brings joy to the doctor. We however see that the HER2 status shows a different dynamic-there are 288 negative and 29 positive patients. HER2-positive breast cancer is an inherently more aggressive type of breast cancer than HER2-negative types so the patients tend to have a relatively poorer prognosis. So I wrote a line of code to indicate which patients are HER2 positive(Poor Prognosis) so that anti-HER2 therapies can be initiated for these patients.
Next, I was interested in the commonest tumor stage among the patients. It tells you how early or late the tumors are discovered. From my analysis, stage 2 cancers were the commonest. Another pie chart evaluating the histological type of the cancers revealed that infiltrating ductal carcinoma were the commonest among the data set.
Now we delve into the main part of this project, using the data set to train a machine learning model to predict if a patient will be alive or dead based on the patient’s data. To begin with, we need to convert the categorical variables to numerical variables:
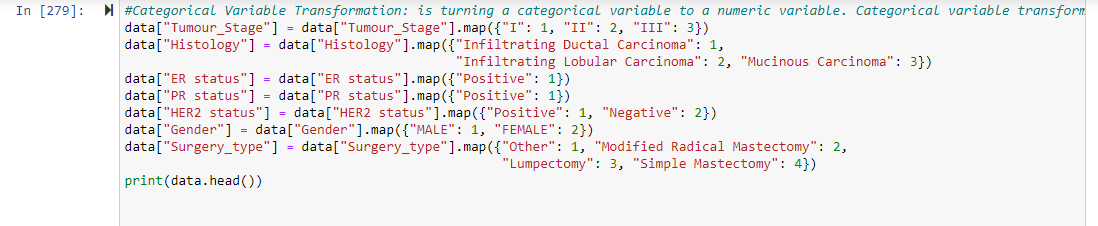
In this instance, we represent stage I tumor as 1, stage II as 2 and stage III as 3. In the same light, we represent male as 1 and female as 2,etc.
Before we train the model, we need to split the data into training set and test set. The simplest way to split the modelling dataset into training and testing sets is to assign 2/3 data points to the former and the remaining one-third to the latter. Therefore, we train the model using the training set and then apply the model to the test set. In this way, we can evaluate the performance of our model.

Then, we train the model

Finally, we can predict if any random patient will be dead or alive by entering the patient details. Let's use a 69 year old female patient, with proteins 1,2,3,4 as 0.21398,1.3114,-0.32747,-0.23426 respectively, stage 3 tumor, infiltrating ductal carcinoma, ER positive, PR positive, HER2 negative and underwent modified radical mastectomy.
 Yaay!!!!Our patient is alive.
To test how reliable the model is, I found out its accuracy using sklearn.metrics’ accuracy_score() function as 81.68%. My training data has significantly more "Alive" data points(255) than "Dead" ones(62) so I presume the prediction accuracy can be improved by collecting more data to have a balance between dead and alive data points.

I absolutely enjoyed working on this project. This is my first attempt at machine learning. I used the SVM algorithm because it produces significant accuracy with less computation power. I also read that it's pretty effective on data sets with multiple features like medical data. I hope to learn more about machine learning and predictive analytics on my data science journey. I also hope that someday Ghana will get a population-based cancer registry so we can start making meaningful insights into our patient's data. You can have access to my codes here


